July 28, 2023
The world is no new to the specter of visualization, which brings yet another dimension to the transcendence of information. The contemporary digital landscape is overwhelmed with a plethora of avenues where data visualization has rendered immense utility in the form of analytical insights wrapped around the visual delight of graphics. It would be a hackneyed statement if one would say that such dashboards simply serve the mere purpose of data presentation without arraigning for the advanced predictive modelling utility that it also brings to the table.
Given such predicaments about these analytic dashboards, our blog aims at replicating the efforts put into the development of such analytic dashboards by gauging the cost incurred in the due course of the process. This would subsequently persuade the decision makers at cutting corners around adopting more frugal means to ideate upon designing an analytic dashboard from scratch.
Need for Analytics Dashboard in the Contemporary Market Landscape
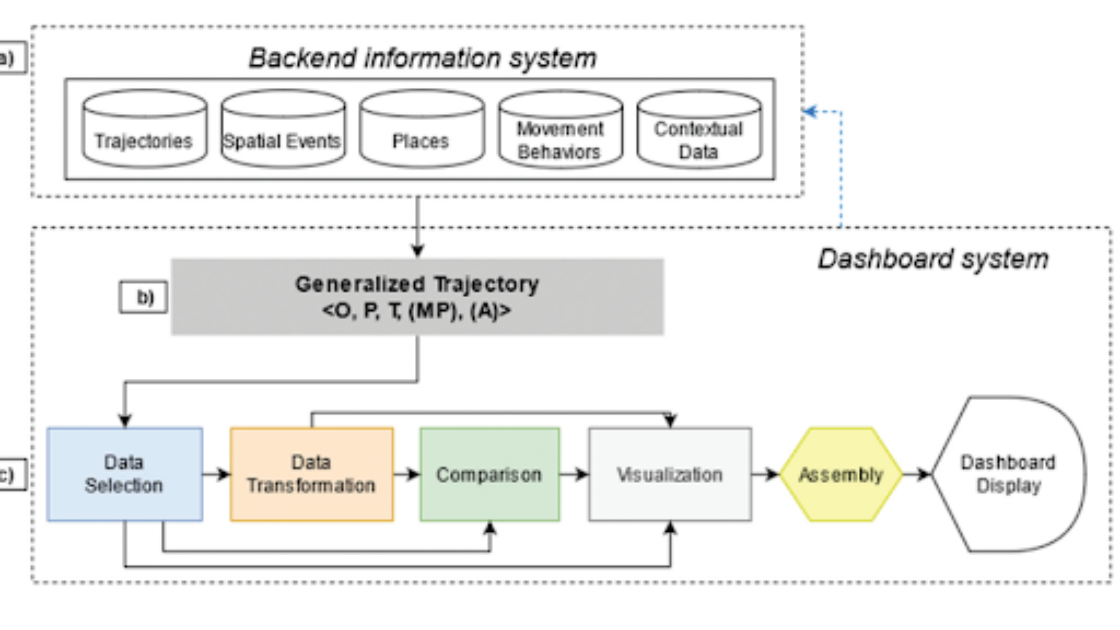
Before tripping over the array of overarching concepts, let’s try and understand the layers of abstraction that make up digital dashboards. First and foremost, these highly sophisticated dashboards play on Online Analytical Processing (OLAP) engines or servers that are responsible for modeling, analyzing and reporting business-oriented data to sustain key decision-making endeavors. In rudimentary terms, it facilitates the core functionality of the analytics dashboard by allowing users to compare data across varied data types and is therefore regarded as the backbone of the digital analytics dashboard.
Much akin to the varied faculties of the human brain, the second yet the most underrated layer associated with digital dashboards correspond to the caching and pre-aggregation layer. This layer typically aids in business contexts where it is quite essential to cut down on the user-facing latency that an application interface is rendered to lightweight applications. However, there are instances where over-reliance on these low-latency databases comes at a cost which sets the stage for some secondary data stores including Snowflake or BigQuery.
Now, one must be wondering what really works behind the scene in translating the data across the product team from the data team. Let’s take this question head-on, to forge an association between the data and product teams API comes as the only resort constituting the third layer, the Middleware layer. This layer is ideally responsible for binding the front-end logic associated with the querying to the back-end database connection, without much emphasis on management-related operations of the database.
Lastly, we come to the superficial aspect of any analytics dashboard that corresponds to its visual element, and which enables interaction across data patterns around discrete data sets. Therefore, as a matter of fact, it becomes extremely essential for an embedded dashboard to ensure the coupling of interaction with presentation feels native. Some of the widely used visualization libraries include Chart.js, D3.js and Highcharts.
Competitive Analysis of Dashboard Market Key Players
Before understanding the multitude of utilities that are catered by dashboards across several business verticals, the only element that shows unison among each other is the orchestration of business intelligence through data sets. To gain a deeper insight into the competitive landscape of the contemporary dashboard market, let’s first understand the intrinsic attributes of each dashboard type. It would further assist the related stakeholders in making the most tenable decision around the category of a dashboard that aligns with the business requirements of an organization. Without further ado, let’s take a vivid look at the subtypes of dashboards that can set a milestone for business intelligence-driven decision-making across industries. The 4 subtypes of dashboards include: strategic, operational, analytical and tactical.
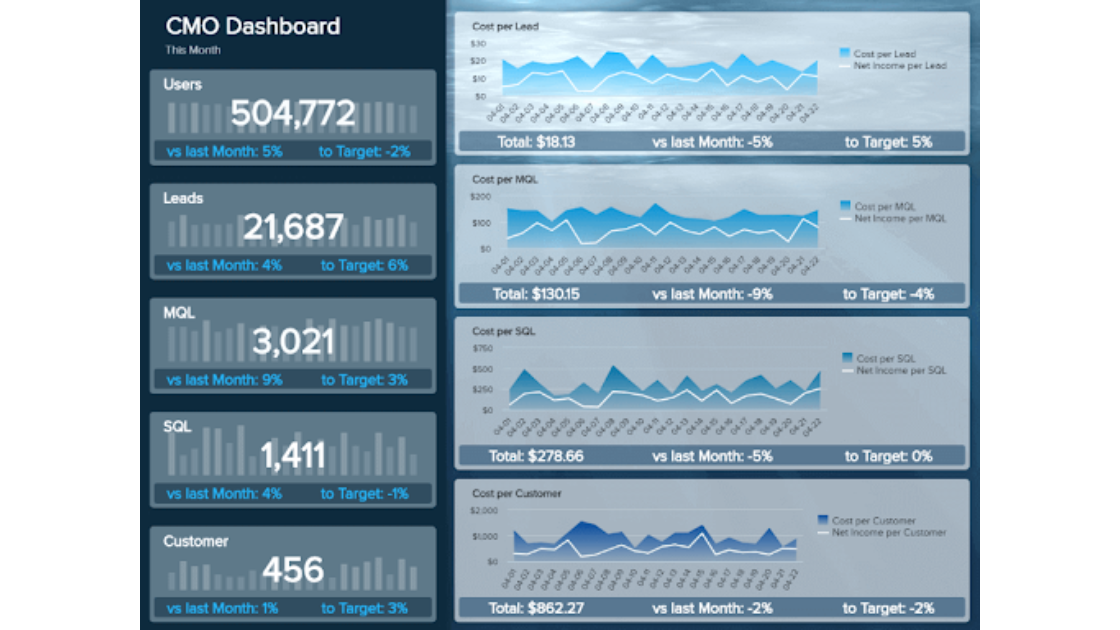
- Strategic Dashboard: It is among the few dashboards type that is built for overseeing long-term organizational strategies and aids in the decision-making of C-suite employees. They are usually complex in nature, intending to narrow down the pan-enterprise strategic goals against a set KPI parameter. To get a fair understanding of the nitty gritty of strategic dashboards, let’s take a few illustrations of widely used strategic dashboards.
- CMO Strategic Dashboard: This specimen of dashboard alludes to the marketing data insights harnessed by Chief Marketing Officers (CMO), who are more into curating high-level strategies based on KPI parameters such as CTR, leads, and acquisition costs among others. Thus, at an executive level such dashboards are kept as an arsenal for drilling down the KPIs to ensure a robust marketing funnel.
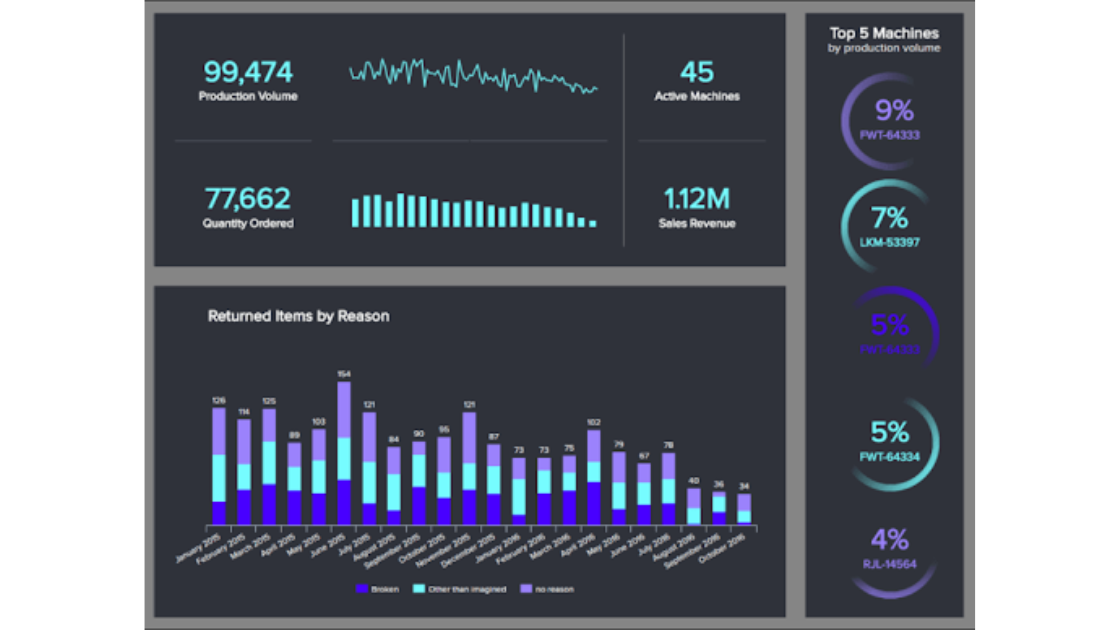
- Operational Dashboard: Contrary to the aforementioned subtype, this type of dashboard is generally roped in for optimizing the short-term performance of operational processes that are usually administered by junior decision-makers. These dashboards are quite detail oriented and offer real team operations insight to the associated managers making them distinguishable from strategic dashboards. For instance, any anomaly in manufacturing operation would reflect through the manufacturing analytics dashboard rendering operational reports alongside data sets. Let’s get this more nuanced with an illustration of a manufacturing production dashboard given below:-
- Manufacturing Production Dashboard: The infographic given below exemplifies a vivid sense of utility that allows the dashboard to constantly keep track of overall activities associated with production that include: volume, quantity ordered, inventory status and machinery maintenance cycle. For instance, the comparison metric of production volume and quantity ordered helps decision makers in ensuring whether the task in hand is performed efficiently or what kind of lean mode of production can be roped in.
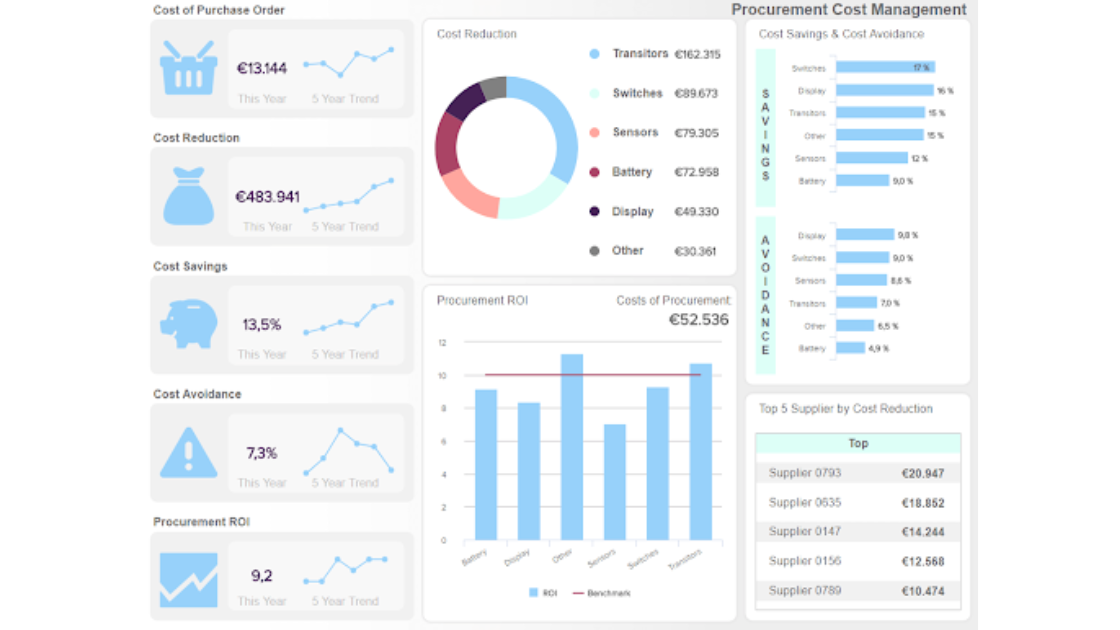
- Analytical Dashboard: This type of dashboard is pertinent to the task of undertaking a comprehensive overview of businesses by analyzing the complex set of historical data that renders empirical evidence to substantiate an organization’s foreplanning. In other words, middle management harnesses such dashboards to ascertain trends across the data sets and forge predictions based on them. Thus, analytical dashboards lie at the intersection of strategic and operational dashboards. To get a better perspective, let’s take a use-specific utility of the aforementioned dashboard through an illustration.
- Procurement Cost Dashboard: The term ‘procurement’ acts as a critical-asset function for any business that acts as a bridge between an organization and its associated stakeholders such as contractors, suppliers and agencies. The below infographic reveals how just by analyzing the cost and purchase of the procurement cycle decision makers can save enormous time and capital on optimizing its R
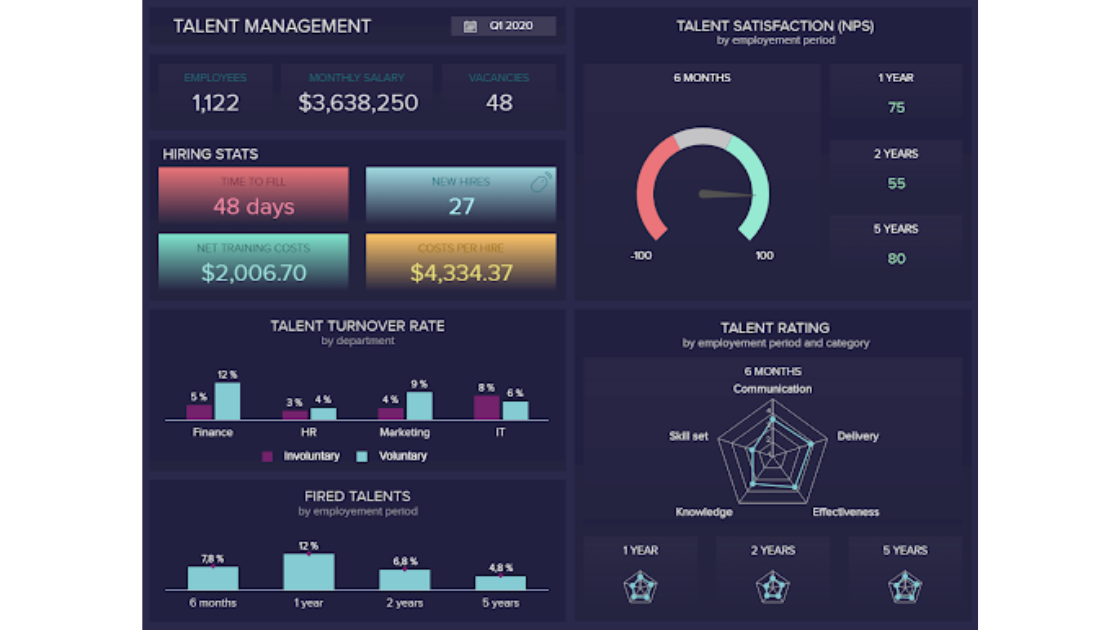
- Tactical Dashboard-: This kind of dashboard further narrows down the monitoring of processes undertaken by middle-level management and acts as a much-refined alternative to analytical dashboards. Moreover, it facilitates the segmentation of insights and drill-down the results to a more localized alternative.
- Human Resource Management Tactical Dashboard: Talent management has remained one of the key stalemate situations that are often faced by the HR departments. Hence, a dedicated talent management dashboard could serve as an instrumental way of keeping a tab on integral KPI elements such as employee turnover rates, hiring costs and employee feedback among others. The graphic below gives a fair understanding of the attributes served by tactical dashboards.
Now, as we have come to terms with the multiple facade of a dashboard ecosystem, let us examine the degree of competitiveness this product brings to the table. As per the report published by FMI, it has been identified that the current valuation of the dashboard market is pegged at $1290 million in 2022, which is expected to clock at $6350 million by the year 2032.
| Market leader | Recent Development | |
| IBM | In 2021, IBM systems introduced a storage system for data management across hybrid cloud, which would ultimately give a fillip to data flexibility. | |
| Salesforce | In 2020, Salesforce deemed as the Global leader in CRM acquired an analytics platform namely Tableau. The acquisition would aid business by generating AI-driven insights facilitating decision making. |
Factors Attributing to the Development Cost of Analytics Dashboard?
As we discussed earlier, contemporary businesses are transcending the conventional barriers of decision-making by incorporating some kind of analytics tool to meet their future expectancy. However, when it comes to the adoption of an analytics dashboard in their mainstream business the folks are quite skeptical about the cost of acquiring an analytics dashboard product. Therefore, this segment deals with a similar problem and aims at deciphering the factors contributing to the developmental cost of such dashboards to cater to the development of custom dashboards. Let’s take a sneak peek into the 4 key factors contributing to its cost-:
Factor 1 (Amount of nature of data): As per the industry estimates, a large chunk of business data is unstructured in nature and resides in on-premises and cloud-based data warehouses subsequently constituting data lakes and data warehouses. However, data lakes are devoid of computational capabilities and thus, require meticulous translation of unstructured information into analytics. This calls for an end-to-end data management strategy of company-wide data assimilation which adds up to the overhead cost. Thus, the formulation of a data management strategy corresponds to one aspect of the factor responsible for the development cost of the analytics dashboard.
Factor 2 (Organization’s data analytics needs): There may be several use-specific instances where an organization would incline towards descriptive data analytics over diagnostic analytics, as the former gives an answer to only a specific business scenario; whereas the latter aims at analyzing the probable factors causing an action. Hence, one can understand that the nature of analytics needs to command over the cost dynamics of such dashboards.
Likewise, for every specific analytic need businesses require a different set of tools. Thus, going ahead with a specific data analytics need, businesses would need to rope in cascading tools to solve a particular set of problems. For instance, products like Kafka and Tableau may be well-suited for visualizing operational data, information exchange between IT hosts, however, may constitute only one module of a complex system. Hence, the selection of tools is another factor that affects the cost of dashboard development.
Factor 3 Software pricing & licensing fees: For each software vendor, there comes a set of overarching features that come in handy at the time of integrating analytics software with your core system. For instance, businesses opting for Power BI software would find key distinctions compared to Tableau in several ways. Firstly, the former performs analyses on both structured and unstructured data that is devoid in the latter’s case. Likewise, in the context of Tableau, one can find smart predictions and recommendations as an added feature thereby, augmenting the cost overhead.
Cost Involved in Development of Custom Analytics Dashboard?
Based on the above understanding, let’s conduct a breakdown of the overall cost associated with the development of a custom analytics dashboard.
| Cost Component | Cost Range (USD) |
| Microsoft Power BI
Tableau Licensing fee+user plan+miscellaneous |
$4995- $5500 per month
$115-$225 per month |
| Cost of developing and implementing an analytics dashboard solution | $1,50000-$2,00,000 |
Also read: Payment Gateway Integration: Simplifying Online Transactions for Businesses
How iWebServices can help in the development of a Custom Analytics Dashboard
Developers at, iWebServices, have pioneered the ingenious development of digital dashboards to pace up with the transition across gaining business intelligence insights to foster decision-making at an exponential rate. We are committed to delivering constant patronage to our clients by ensuring scalable analytics solutions with real-time insights powered by Tableau-based data visualization and mobility solutions for all your business needs. Contact us, for consulting a customized Tableau server and desktop implementation regime.


Mahabir
Mahabir is the founder and CEO of iWebServices. He specializes in guiding startups, enterprises, and Fortune 500 companies through their digital transformation journeys. Under his leadership, the company has developed over 1300 digital products, including mobile apps, SaaS platforms, and advanced AI and blockchain solutions. Mahabir's passion for technology, adaptability to emerging tech trends, and visionary leadership qualities have positioned him as an influential figure in the pursuit of digital product investment.